Further Analysis of October HQ Energy Efficiency Competition
Following on from the results of the competition in October, we have conducted further analysis of the data in three main areas:
- What did the leading departments do to win the competition;
- What did the competition achieve in terms of carbon reductions; and
- What did the competition achieve in terms of financial savings?
1. What did leading departments do to win the competition?
Firstly, leadership in departments, generally from Permanent Secretaries and Directors General, has been important in achieving results. The impact of senior staff taking this seriously and providing leadership cannot be underestimated.
Effective communications and engagement with staff about the competition was a key factor for success. Displays in departmental reception areas showing the league table through the month, pledge boards where individual staff and leaders could make a personal commitment to do their bit, leafleting staff, “green fairs” and lots of good work through networks of “green champions” all contributed.
The competition has focussed the minds of most departments (and of the practitioner network in departments) more actively on their Facilities Management – strongly encouraging better shut-down over weekends and overnight, tighter control of temperatures within buildings and delaying the point in the month at which winter heating was turned on. We think this is probably the source of the bulk of the savings in October – certainly this is the case in the winning department, DWP.
There is an important lesson to learn in terms of the timing of the exercise – and this links to the point about achieving senior buy-in above: many departments, not least HMT, were very busy with the Spending Review for the first part of the month. Some departments were more concerned about the overall 10% target on the entirety of their estate than the October competition.
In Chart 1 we consider the energy profiles for 6 departments to compare some of the key features.
Chart 1: Energy consumption of a selection of HQ buildings through September and October, rebased to 1.
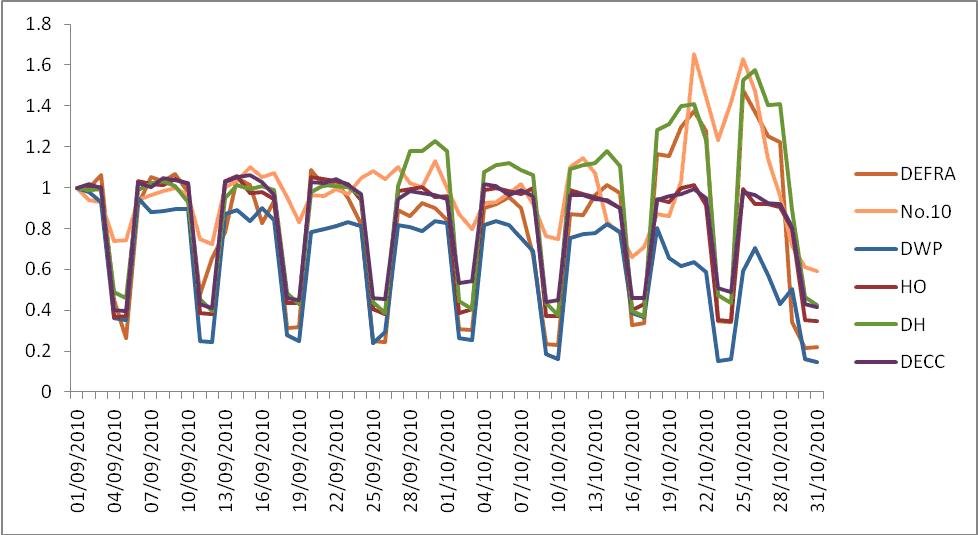
Some key points to note are:
- DWP achieved the lowest weekend energy use relative to weekday energy consumption.
- Whilst most departments’ energy use increased through the month of October, as weather got colder, DWP actually managed to reduce its energy consumption (DECC and HO also managed to achieve reductions).
- Throughout October, DWP and Home Office achieved a very noticeable downward trend in weekday energy consumption.
- Unsurprisingly, buildings used solely as offices were capable of significant energy reduction over the weekend whereas buildings which are mixed residential and office use (such as Number 10) or have operational units which operate 24/7 (such as MoD and Cabinet Office) did not achieve the same weekend reductions.
- In some headquarter buildings (including DEFRA, DH and No.10) we see increases in energy consumption as heating systems were switched on.
2. What did the competition achieve in terms of carbon reductions?
One of the key benefits of reducing energy consumption is the carbon savings. The competition league table was based on energy consumption (in kWh); in the table below we consider how departments would have fared if we had considered this from a carbon perspective.
Chart 2 below shows how departments managed to reduce their carbon emissions between September and October, using the same methodology as the competition. We have used the same carbon conversion factors as used in Sustainable Development in Government calculations (Electricity 0.54055 kgCO2 per kWh; Gas 0.18358 kgCO2 per kWh; Heat 0.25698 kgCO2 per kWh).
Chart 2: League table based on Carbon Emissions for HQ buildings.
|
Rank (carbon) |
Department |
Carbon Percentage (Reduction) / Increase |
Rank (KWH) |
KWH Percentage (Reduction) / Increase |
Change in league table position using carbon rather than KWH |
|
1 |
DWP |
-19% |
1 |
-22% |
- |
|
2 |
HO |
-8% |
3 |
-9% |
U |
|
3 |
BIS |
-6% |
2 |
-9% |
D |
|
4 |
MoJ |
-5% |
8 |
-2% |
U |
|
5 |
FCO |
-4% |
4 |
-7% |
D |
|
6 |
DECC |
-3% |
5 |
-7% |
D |
|
7 |
DfT |
-3% |
7 |
-3% |
- |
|
8 |
DfE |
-1% |
12 |
2% |
U |
|
9 |
MoD |
0% |
9 |
0% |
- |
|
10 |
CLG |
0% |
16 |
5% |
U |
|
11 |
HMT |
1% |
6 |
-4% |
D |
|
12 |
DfID |
1% |
15 |
4% |
U |
|
13 |
DEFRA |
2% |
14 |
3% |
U |
|
14 |
DCMS |
3% |
17 |
9% |
U |
|
15 |
HMRC |
5% |
10 |
2% |
D |
|
16 |
CO |
5% |
11 |
2% |
D |
|
17 |
No.10 |
9% |
13 |
3% |
D |
|
18 |
DH |
10% |
18 |
14% |
- |
U = positive change
D = negative change
The league table in Chart 2 shows some movement in the rankings. Some key differences between this table and the kWh table are:
- Home Office moves to 2nd place (from 3rd)
- MoJ moves to 4th place (from 8th)
- CLG moves to 10th (from 16th ) place and shows that while their building used 10% more energy in October than it did in September there was no change to the amount of carbon dioxide emitted from the building. This is because the increase in energy was predominantly from additional gas utilisation which has a smaller carbon dioxide conversion factor than electricity (i.e. gas is cleaner, as the same kWh output produces less carbon).
3. What did the competition achieve in terms of financial savings?
Another key benefit of reducing energy consumption is the potential to make financial savings. The chart below shows the percentage change in average cost of energy in the month of October compared to the month of September.
This is calculated using the average cost of electricity, gas and heat using figures which were obtained from the Cabinet Office centralised energy procurement figures (rather than being based on actual department expenditure). The average costs per kWh are: Electricity 8.5p; Gas 1.8p, Heat 2.9p.
Chart 3: Energy costs in October compared with September: financial savings
This chart shows the estimated financial savings made by departments between September and October through the energy efficiency competition. This chart shows an overall net saving of circa £19k across the 18 headquarter buildings between October and September.
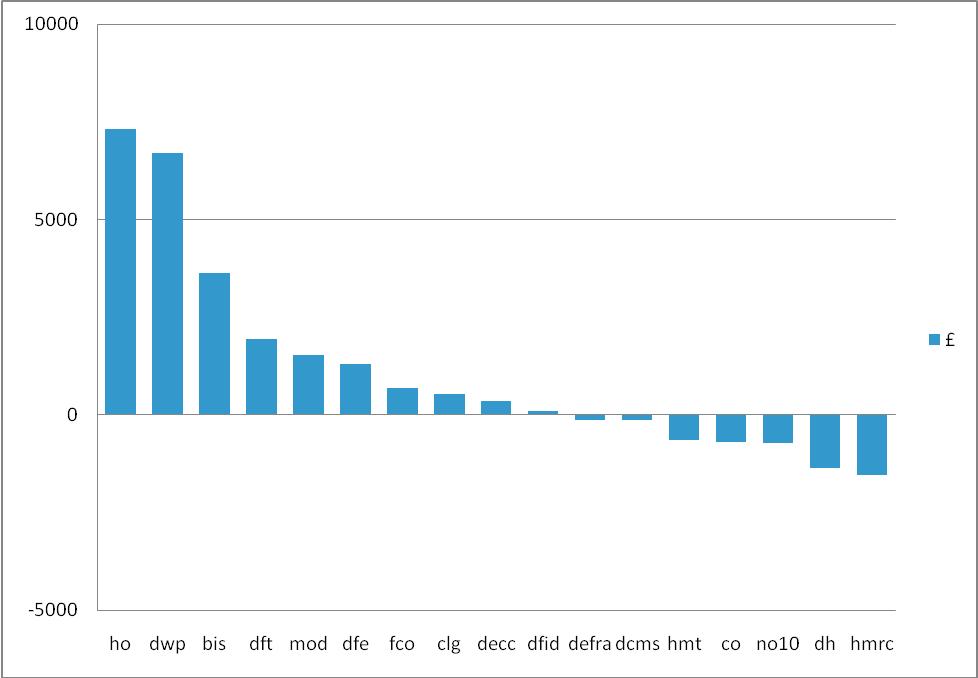
Home Office and DWP are the main contributors to financial savings in the month (accounting for 75% of the estimated saving across the 18 buildings).
Find out more about the original competition here
2 comments
Comment by pfakredit posted on
I guess comparing september with octobre is one of the most interesting monthly comparisons due to the fact that in september you partly have to cool things down whereas in october it could already happen that you got to heat buildings.
Comment by Anonymous posted on
This idea is a great one. If all countries would implement these ideas so much more energy could be saved. Most people have a competition mechanism built in. And with the incentive to compete mixed in with the 'how to save energy' ideas, the specifics on how to save energy may stick in one's mind better than just telling them how to save and that they should save energy.