The government is currently releasing lots of data through data.gov.uk. With
new data available every day, it can be really interesting to hunt down data
sets and plot them on a graph to get a feel for the numbers. This is pretty
simple to do in jQuery in your browser, without even having to load files into
Excel. This scripting ability gives rise to lots of opportunities. You could
look through lots of data at once, calculate trends, spot interesting outliers,
or show an up-to-date graph on your website.
Contents
The government is currently releasing lots of data through data.gov.uk. With new data available every day, it can be really interesting to hunt down data sets and plot them on a graph to get a feel for the numbers. This is pretty simple to do in jQuery in your browser, without even having to load files into Excel. This scripting ability gives rise to lots of opportunities. You could look through lots of data at once, calculate trends, spot interesting outliers, or show an up-to-date graph on your website.
In this post I'm going to show you how to build a graph in a web browser, but first you'll need to get a handle on the data.gov.uk APIs for navigating the data catalogue. I'll show you three different approaches which will suit people with different skills. They are all quick to learn and very powerful.
I'm going to cover:
- Accessing data from the command line - good for calling by bash scripts, perl etc.
- Writing a program in Python - handy if you are building a web server which uses the data.gov.uk API
- Accessing the data directly from a browser - ideal for building mashups or browser-based applications
We'll cover the first two cases fairly quickly and then concentrate on building the graphs with JavaScript.
Note
You can download the source code that accompanies this post and use it as a basis for your own applications. It is released under the very permissive MIT license.
dgu_example_code.zip.
Understanding the Catalogue
The data.gov.uk website is powered by the CKAN catalogue from the Open Knowledge Foundation which also powers ckan.net. Because the site is built on CKAN it means that existing tools which use the CKAN API will also work on data.gov.uk. You'll see an example of one such tool later on.
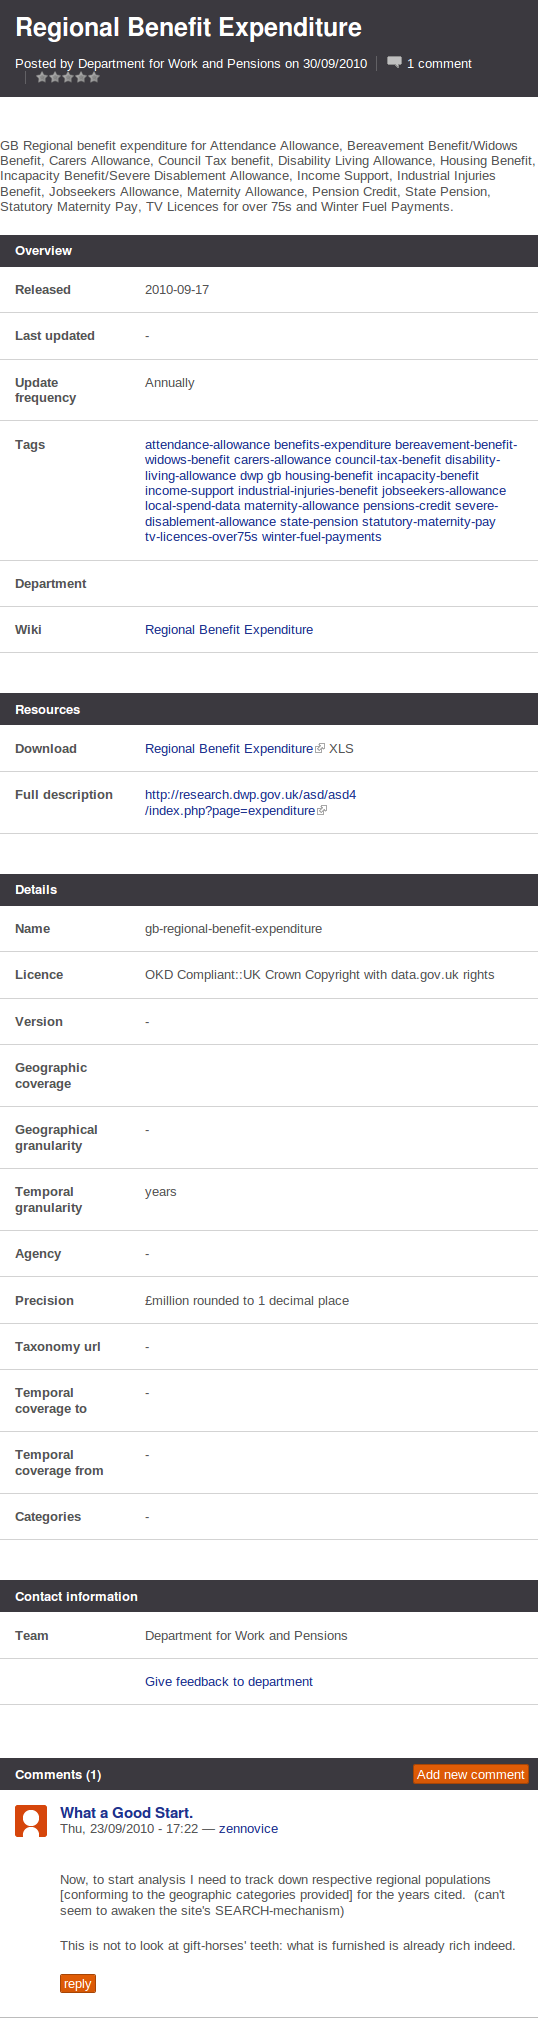
Whilst the data.gov.uk website provides a nice interface to search and explore the catalogue, the API gets you straight to the catalogue data in CKAN itself. To get a feel for the API it is handy to understand how data sets are organised in CKAN. Let's have a look at how a typical package appears on the data.gov.uk website. Here's the Regional Benefit Expenditure package:
A screenshot of the benefit page data
As you can see the package contains an overview section with a set of tags showing related datasets, a resources section with links to the actual data, a details section with information about the package, some contact information and comments. We can't use the API to explore the comments, since they are part of the website rather than the catalogue, but we can use the API to explore everything else.
The latest version of the CKAN API is version 2. The data.gov.uk implementation of this API can be found at:
Note 2/4/13: The API was originally hosted at http://catalogue.data.gov.uk/api but in July 2012 it was moved to http://data.gov.uk/api and this guide has been updated to reflect that.
It is really easy to use the API, so let's make a start.
1. Command Line Access
To use the API information from the command line on Mac OS X or Linux you could use the curl program to perform a GET request to the API URL. There is also a version of curl for Windows here.
Here's an example where we get a list of all the packages with the dwp tag:
> curl http://data.gov.uk/api/2/rest/tag/dwp
["dwp-energy-and-water-consumption", "dwp-climate-change-adaptation-plan", \
"dwp-carbon-reduction-delivery-plan", \
"dwp-sustainable-development-annual-report-2009", \
"gb-regional-benefit-expenditure", \
"dwp-sustainable-development-policy-statement", \
"dwp-sustainable-development-annual-report-2008"]
As you can see, the result is printed to the command line and our gb-regional-benefit-expenditure is included in the results because it is tagged dwp. To get curl to save data to a file named dwp-packages.json instead of printing it out you would run:
> curl http://data.gov.uk/api/2/rest/tag/dwp > dwp-packages.json
All the other API calls work the same way. Just choose the correct URL for the API you wish to use.
2. Python Access
You can also use a programming language such as Python to fetch results.
Here's an same example written in Python 2.6 that simply prints a list of the
names of available licenses:
import urllib2
import json

fp = urllib2.urlopen('http://data.gov.uk/api/2/rest/licenses')
results = json.loads(fp.read())
fp.close()

for license in results:
    print license['title']
If you were to save this as fetch_version.py you could run it like this and
the output would be 2:
> python fetch_licenses.py
UK Crown Copyright with data.gov.uk rights
Higher Education Statistics Agency Copyright with data.gov.uk rights
Local Authority Copyright with data.gov.uk rights
The advantage of writing a program rather than just using the command line is
that you can easily parse and manipulate the data. In this case we are simply
printing out the title attribute of each license, even though the API
returns other attributes too such as status, maintainer, family, tags, url,
is_okd_compliant, is_osi_compliant, date_created, and id.
The ckanclient Library
Because data.gov.uk is built on CKAN you can also use any existing tools built
to work with CKAN instead of having to work at the HTTP level. One such tool is
called ckanclient. You can download it from
http://pypi.python.org/pypi/ckanclient/. At the time of writing the latest
version is 0.3.
Here's some code to get the license list using ckanclient instead of making
the GET request manually:
import ckanclient

ckan = ckanclient.CkanClient(base_location='http://data.gov.uk/api/2/')
for tag in ckan.tag_register_get():
    print tag
This is a little easier. Be aware that the library doesn't currently contain
facilities for handling all API calls yet so you may have to use the previous
method occasionally.
The example is in the example code as fetch_tags.py but you'll need to
install ckanclient first to run it.
3. JavaScript Access
Since open data is all about the web and since JavaScript is implemented by
almost all web browsers, it would be nice to be able to access these APIs
directly from a web browser using JavaScript.
One restriction of JavaScript in a web browser is that you can only make API
calls for JSON data from the same domain as the domain the page was served
from. This is called the same origin policy and is designed to stop a
site such as "Fluffy Kittens" making requests to your internet banking site
without you knowing if it happens to be open at the same time.
To work around this restriction we need to retrieve data in a slightly
different format called JSON-P which isn't subject to the same restrictions
so that a browser can read the API, even if the page it has loaded comes from a
different domain. Luckily the CKAN API supports JSON-P too, you just have to
enable it.
To trigger JSON-P mode instead of JSON mode you need to add a query parameter
named callback to the API URL. In this case, rather than accessing
http://data.gov.uk/api/2 you would access
http://data.gov.uk/api/2?callback=jsonpcallback. Whatever you place
as the value of the callback parameter will be used as the function name
for the JSON-P response data.
To call this API from JavaScript we'll use jQuery. You'll need an empty page
with jQuery present, we'll use the version of jQuery hosted by Google. Save
this as index.html:
<!DOCTYPE html
    PUBLIC "-//W3C//DTD XHTML 1.0 Transitional//EN"
    "http://www.w3.org/TR/xhtml1/DTD/xhtml1-transitional.dtd">
<html xmlns="http://www.w3.org/1999/xhtml" lang="en" dir="ltr">
<head>
<title>API Examples</title>
<meta http-equiv="Content-Type" content="text/html; charset=UTF-8" />
<script type="text/javascript"
    src="http://ajax.googleapis.com/ajax/libs/jquery/1.4.2/jquery.min.js">
</script>
</head>
<body>
    <h1>API Examples</h1>
    <ul id="examples">
    </ul>
    <div id="result"></div>
    <script type="text/javascript" src="api.js"></script>
</body>
</html>
Now we'll need to write the JavaScript code. Save this as api.js in the same directory:
$.ajax({
url: 'http://data.gov.uk/api/2/rest/package',
type: 'GET',
success: function(data){
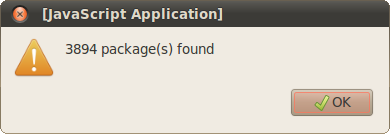
alert(data.length+' package(s) found')
},
error: function() {
alert('Failed to get the list of packages.')
},
dataType: 'jsonp',
jsonpCallback: 'jsonpcallback'
});
There are a couple of things to notice here. We are using the GET method as
before but we tell jQuery to use a dataType of jsonp (technically this
means it isn't really an AJAX call at all, even though we can still use the
$.ajax() function). If the query is successful an alert will pop up showing
the number of packages, otherwise you'll get an error message.
Have a go and after a few seconds you should see something like this:
We'll use this basic structure again in the following examples with different
APIs.
List of API Calls
Here is a list of some of the APIs you can now use and their corresponding URLs:
| Model Resource | Location |
|---|---|
| Package Register | /api/2/rest/package |
| Package Entity | /api/2/rest/package/PACKAGE-REF |
| Tag Register | /api/2/rest/tag |
| Tag Entity | /api/2/rest/tag/TAG-NAME |
| License List | /api/2/rest/licenses |
| Tag counts | /api/2/tag_counts |
There are also some search APIs which work in a similar way which we'll look at
later. Here they are for reference though:
| Model Resource | Location |
|---|---|
| Search Packages | /api/2/search/package?q=<terms> |
| Search Resources | /api/2/search/resource?q=<terms> |
| Search Revisions | /api/2/search/revision?q=<terms>&since_time=<2010-09-01> |
Building Browser Applications and a Graph
Now that you can make API calls from a browser, let's build some simple
applications and plot a graph. For each of these examples we'll use the same
index.html file as before and just change the api.js file.
Listing Packages
Let's start by building an application to list the packages by name rather than
just displaying a total count. Replace api.js with this content:
// List all packages example

$('#examples').append('<li id="list"><a href="#">List all packages</a></li>');
$('#list').click(function(e) {
    e.preventDefault();
    $.ajax({
        url: 'http://data.gov.uk/api/rest/package',
        type: 'GET',
        success: function(data){
            render_results(data);
        },
        error: function() {
            alert('Failed to get the list of packages.')
        },
        dataType: 'jsonp',
        jsonpCallback: 'jsonpcallback'
    });
});

// Render a list of packages to the results <div>

var render_results = function (packages) {
    $('#result').html('<ul id="packages"></ul>');
    for (var i=0; i<packages.length; i++) {
        $('#packages').append('<li>'+packages[i]+'</li>');
    }
};
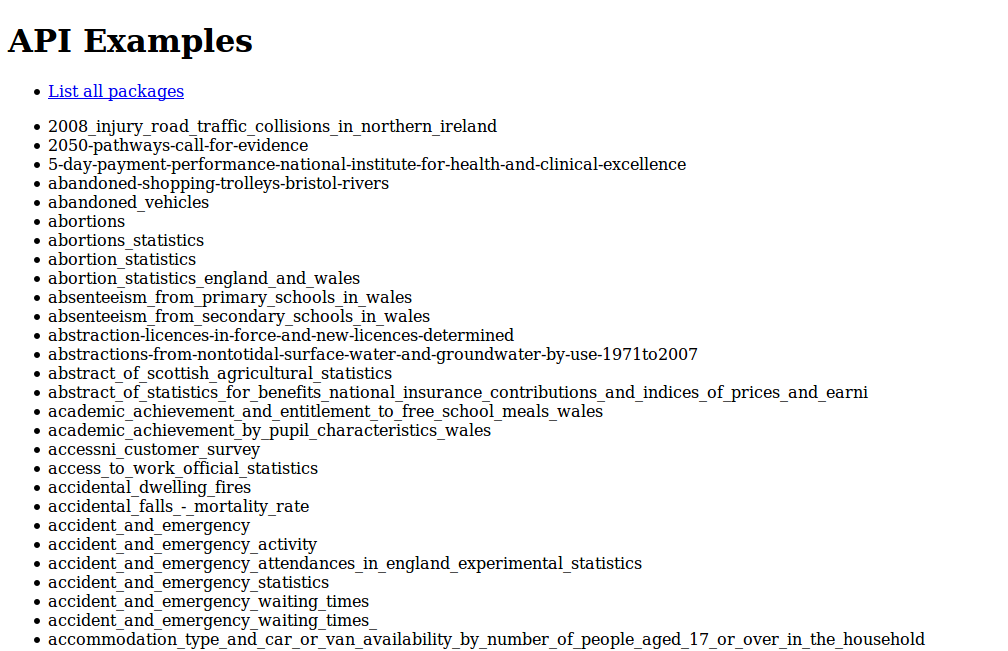
When the script loads it adds a "List all packages" link to the list at the
top. When you click the link, a request is made to the API to get a list of
all packages in JSON-P format. These packages are then displayed one by one in
the results <div> using the render_results() function.
If you look carefully at this example you'll notice that we are using the
version 1 API for this call. That's because it returns package names by default
whereas the version 2 API returns package IDs. In a real application you would
look up each of the packages returned anyway using the Package Entity API so it
wouldn't matter whether you used an ID or a name, but for this simple example,
names are more human-friendly. You'll see how to use the Package Entity API
later on.
Here is what you see when you try this example. It can take a few seconds after
you first click the link before the results appear:
A screenshot of the package list
Returning a list of packages can be a slow operation. Most of the time you'll
want to use the search API. Let's look at that next.
Implementing Search
So far you've been using the Model API, so called because it reflects aspects
of the way the data is modelled in the underlying CKAN software. There is also
a Search API which can be used for searching the package data.
The package search API can be found at
http://data.gov.uk/api/2/search/package and can return JSON-P data,
just like the other APIs. The API also takes a series of parameters which
specify things like what to search for, which page of results to return and
whether to return package IDs or full package information.
Here are some of the main query options you can add. The most important is
q which is the parameter you use to specify what to search for:
| Param-Key | Param-Value | Examples | Notes |
|---|---|---|---|
| q | Search-String |
q=geodata
q=government+sweden
q=%22drug%20abuse%22
|
Criteria to search the package fields for. URL-encoded search text. (You can also concatenate words with a '+' symbol in a URL.) Search results must contain all the specified words. |
| title, tags, notes, groups, author, maintainer, update_frequency, or any 'extra' field name e.g. department |
Search-String |
title=uk&tags=health+census
department=environment
|
Search in a particular a field. |
| order_by | field-name (default=rank) |
order_by=name | Specify either rank or the field to sort the results by |
| offset, limit | result-int (defaults: offset=0, limit=20) |
offset=40&limit=20 | Pagination options. Offset is the number of the first result and limit is the number of results to return. |
| all_fields | 0 (default) or 1 |
all_fields=1 | Each matching search result is given as either a package name (0) or the full package record (1). |
| filter_by_openness | 0 (default) or 1 |
filter_by_openness=1 | Filters results by ones which are open. |
| filter_by_downloadable | 0 (default) or 1 |
filter_by_downloadable=1 | Filters results by ones which have at least one resource URL. |
Let's update the api.js file to also support a search operation. Add this after the existing code:
// Search packages example

$('#examples').append('<li id="search"><a href="#">Search package metadata</a></li>');
$('#search').click(function(e) {
    e.preventDefault();
    var search_form = '';
    search_form += '<form id="search_form">';
    search_form += 'Search: <input type="test" id="terms" name="q" />';
    search_form += '<input type="submit" value="Go" />';
    search_form += '</form>';
    $('#result').html(search_form);
    $('#search_form').submit(function(e) {
        e.preventDefault();
        $.ajax({
            url: 'http://data.gov.uk/api/2/search/package',
            type: 'GET',
            data: {'q': $('#terms').val(), 'all_fields': '1'},
            success: function(data){
                alert('Found '+data['count']+' result(s)')
                packages = []
                for (var i=0; i<data['results'].length; i++){
                    packages.push(data['results'][i]['name']);
                }
                render_results(packages);
            },
            error: function() {
                alert('Failed to search the packages.');
            },
            dataType: 'jsonp',
            jsonpCallback: 'jsonpcallback'
        });
    });
})
Notice that we are using the all_fields option set to 1 so that the
results contain information about the package, not just its ID.
When you click the link you the search box appears. If you enter "Benefit
Expenditure" and click the "Go" button, a GET request is sent to
http://data.gov.uk/api/2/search/package?callback=jsonpcallback&q=Benefit+Expenditure&all_fields=1
Here's the search box:

A screenshot of the search box
The data returned looks like this (some parts excluded for brevity):
jsonpcallback({
    "count": 136,
    "results": [
        {
            "id": "32710be3-5f8e-4351-920b-051b486fe483",
            "name": "gb-regional-benefit-expenditure",
            "title": "Regional Benefit Expenditure",
            ...
            "resources": [
                {
                    "id": "9b3f2097-b957-4096-a9a0-9c994e8c98f3",
                    "package_id": "32710be3-5f8e-4351-920b-051b486fe483",
                    "url": "http://research.dwp.gov.uk/asd/asd4/r1_values.xls",
                    "format": "XLS",
                    "description": "Regional Benefit Expenditure",
                    ...
                },
                ...
            ],
            ...
        },
        ...
    ]
})
You can now search packages!
Displaying information about packages
Now that you can list packages and search for them, it is time to learn how to
retrieve package metadata using the Package Entity API. Of course if
you use the all_fields option when searching you will get this information
anyway, but there are other times such as when you retrieve a list of all
packages, when you will want to get further information about a specific
package.
Let's update the render_response() function so that when you click any item
in the package list or search results, an API call is made to the Package
Entity API to get and print information about that package, including the URLs
of any resources associated with it. Here's the updated code:
var render_results = function(packages) {
    $('#result').html('<ul id="packages"></ul>');
    for (var i=0; i<packages.length; i++) {
        var elem = $('<li><a href="#">'+packages[i]+'</a></li>')
        elem.click(function(e){
            e.preventDefault();
            var url = 'http://data.gov.uk/api/2/rest/package/';
            url += $(this).find('a').html();
            $.ajax({
                url: url,
                type: 'GET',
                success: function(data){
                    var output = '<p>'
                    for (name in data) {
                        if (data.hasOwnProperty(name)) {
                            if ( name == 'resources' ){
                                var urls = '';
                                for (var j=0; j<data[name].length; j++) {
                                    urls += '<a href="'+data[name][j]['url']+'">';
                                    urls += data[name][j]['url']+'</a>';
                                }
                                output += name+': '+urls+'<br />';
                            } else {
                                output += name+': '+data[name]+'<br />';
                            }
                        }
                    }
                    output += '</p>'
                    $('#result').html(output);
                },
                error: function() {
                    alert('Failed to search the packages.');
                },
                dataType: 'jsonp',
                jsonpCallback: 'jsonpcallback'
            });
        });
        $('#packages').append(elem);
    };
};
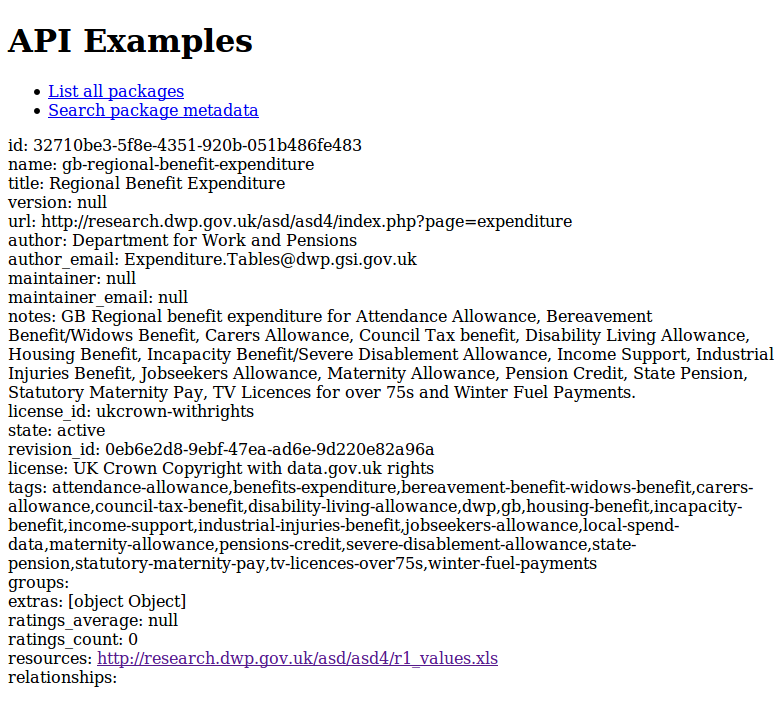
If you searched for and clicked on the gb-regional-benefit-expenditure
package, this code would make an API call to
http://data.gov.uk/api/2/rest/package/gb-regional-benefit-expenditure.
We can then loop through the result, printing out the keys and values in the
returned data.
Here's how the result looks:
Package listing
Plotting a Graph
At this point you might want to actually fetch the data linked to by the
package and manipulate it. Currently you can't do that in a browser, because
once again the same origin policy feature of browser security prevents you
accessing data from other sites (a problem we are working on!). Instead let's
download the data from http://research.dwp.gov.uk/asd/asd4/r1_values.xls and
take some of the values we need.
Here's some information about Statutory Maternity Pay Benefit Expenditure by Country:
          2004/05  2005/06   2006/07  2007/08  2008/09  2009/10
ENGLAND   1,129.8  1,036.9   1,128.9  1,287.9  1,533.0  1,555.5
WALES     60.3     55.2      59.3     68.0     81.2     82.4
SCOTLAND  100.6    91.3      98.2     112.0    135.9    137.9
Of course you could use these numbers to plot a graph in Excel, but we're going
to plot a graph using JavaScript in a web browser. Create a new file called
graph.html with this content:
<!DOCTYPE html PUBLIC "-//W3C//DTD XHTML 1.0 Transitional//EN"
"http://www.w3.org/TR/xhtml1/DTD/xhtml1-transitional.dtd">
<html xmlns="http://www.w3.org/1999/xhtml" lang="en" dir="ltr">
<head>
<title>API Examples</title>
<meta http-equiv="Content-Type" content="text/html; charset=UTF-8" />
<script type="text/javascript"
src="http://ajax.googleapis.com/ajax/libs/jquery/1.4.2/jquery.min.js"></script>
<script type="text/javascript"
src="jqplot/jquery.jqplot.min.js"></script>
<script type="text/javascript"
src="jqplot/plugins/jqplot.categoryAxisRenderer.min.js"></script>
<script type="text/javascript"
src="jqplot/plugins/jqplot.barRenderer.min.js"></script>
</head>
<body>
<h1>Results Chart</h1>
<div id="chart1"></div>
<script type="text/javascript">
england = [1129.8, 1036.9, 1128.9, 1287.9, 1533.0, 1555.5];
wales = [60.3, 55.2, 59.3, 68.0, 81.2, 82.4];
scotland = [100.6, 91.3, 98.2, 112.0, 135.9, 137.9];
plot1 = $.jqplot('chart1', [england, wales, scotland], {
stackSeries: true,
legend: {show: true, location: 'nw'},
title: 'Statutory Maternity Pay Benefit Expenditure by Country',
seriesDefaults: {renderer: $.jqplot.BarRenderer,rendererOptions: {barWidth: 100}},
series: [{label: 'England'}, {label: 'Wales'}, {label: 'Scotland'}],
axes: {
xaxis: {
renderer: $.jqplot.CategoryAxisRenderer,
ticks:['2004/05', '2005/06', '2006/07', '2007/08', '2008/09', '2009/10'],
},
yaxis: {
min: 0,
max: 2000,
numberTicks:5,
tickOptions:{formatString:'£%dm'}
}
}
});
</script>
</body>
</html>
This code relies on a jQuery plugin called jqPlot.
You can download the latest version here. You'll need to put the
jqplot libraries in the same directory as graph.html. If you are using the
example code, the library is already present.
To plot the graph you need to give the $.jqplot() function a list of data.
In this case ticks should be filled with the column headings and the values
for each of England, Wales and Scotland are passed as the second argument.
If you run this in a web browser you'll see the following output:
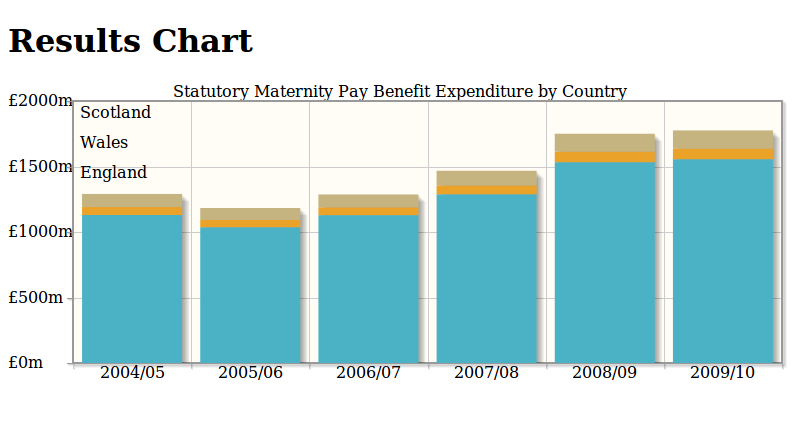
A plot of the results
There are other libraries for displaying data in a browser. Raphaël JS and its graphing counterpart gRaphaël are good examples that will also work in old
browsers such as IE6 (albeit slowly). Another option is to use static images or
flash and Google Charts is good option
in this case.
Next Steps
Hopefully this post will have given you a flavour for how you can work with the
CKAN APIs on data.gov.uk, particularly in a web context. It is worth noting
that because the APIs use the standard HTTP protocol you can easily work with
them from any programming language including C#, Java, Ruby, Python, Perl, PHP
and others.
I'd encourage you to experiment with the APIs but please do bear in mind that
they are new and that there may be a few teething problems to start with. In
the future it would be great to expose APIs that let you work with the actual
data from a browser without needing to use a language like Python to download
the files. This is something the team will look further into in the future.
If you'd like to get further inspiration I'd recommend you look at some of
these links to get an idea of what can be done with data visualisations:
You can also see the sorts of applications already being build with government
data here:
Even if you don't fancy writing an entire app yourself, you can still work with
other people or share ideas:
Further resources:
6 comments
Comment by psychemedia posted on
If the CKAN directory listing for the data file points to a CSV file, depending how big it is you may be able to use something Yahoo pipes or YQL as a proxy, and simply use one of those services to convert from the CSV file (as identified by a URL) to a JSON representation that can be pulled into a web page. Alternatively, if you upload the file to a Google spreadsheet (there is probably a way to do this programmatically via a google api somewhere), you can then make use of the Google visualisation API to get data out and generate charts using Google components. eg http://blog.ouseful.info/2010/06/25/using-csv-docs-as-a-database/
Comment by Anonymous posted on
I made a Table of Licenses with python on ScraperWiki to demo the Catalogue APIs.David Pidsleyhttp://davidpidsley.com@davidpidsley
Comment by Anonymous posted on
It's good that CKAN is providing an API, and good that it exchanges structured text of HTTP, and of course good that they're publishing the API even as it develops.
But why roll your own interface, rather than building on existing open registry interfaces from e.g. OASIS or OGC? This may be fine for "hobby developers", or those with the budget to develop a bespoke system against CKAN's specific API, rather than leveraging any existing client tools, or at least developing something that would also work against other registries.
Where the others looked at and found wanting?
Comment by Anonymous posted on
Hi,
not sure what happened to yesterday's comment, perhaps it's still awaiting moderation.
Anyway, today (on behalf of my employer, the Ordnance Survey), I'd like to know how to interpret the fields that are returned in the JSON. I've looked around on the CKAN & OKF websites, as per the links, and not got far.
Specifically, in the info returned from http://catalogue.data.gov.uk/api/2/rest/licenses, what do
"is_okd_compliant" and
"is_osi_compliant" mean? And what would "family" and "tags" be used for, if they were populated?
Peter
Comment by Anonymous posted on
I tend to agree with the comment about 'rolling-your-own'. I think the priority should be to expose the catalogue through standard APIs, e.g. OAI and OGC CSW. This encourages the re-use of software, as well as data!
Comment by Anonymous posted on
Hi,
Can I specify a condition in the query? For example I want all packages where the date_released is greater than a date.
I can do this for an exact date:
curl http://catalogue.data.gov.uk/api/2/search/package?date_released=2010-11-01
but I also would love to do this (%3E is the encoded greater than symbol by the way):
curl http://catalogue.data.gov.uk/api/2/search/package?date_released=%3E2010-11-01
Is there a syntax defined for this?
Thanks.