This week we have launched a revamped system for publishing data on staff roles and salaries across government departments, agencies and other bodies.
This ‘organogram’ data shows the hierarchy of senior civil servants, their pay and responsibilities. Junior staff are also included, but aggregated by job title and grade. This data is published twice a year on data.gov.uk as files in CSV format and visualised for easy exploration via the organograms tool.
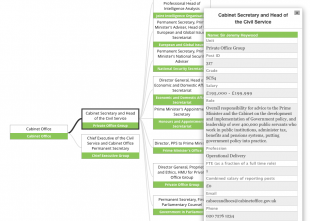
For example, here are the top staff at the Cabinet Office as of March 31, 2016:
Publication process
After the publication of the transparency commitments in May 2010, the organograms weren’t initially published in an open format, but mainly as a visual representation in a PDF or Powerpoint format.
Soon after, data.gov.uk developed a spreadsheet template to capture the data, and tools to publish and visualise it, so it was easy to understand.
The tools were ambitious but complex and didn’t provide a great user experience for publishers. Uploading the data was inefficient and cumbersome, and users would often see confusing error messages if there was a problem with the file they were trying to upload. We've now been able to dedicate resources to fix these issues and improve the process.
We've vastly improved the whole process now, making it much easier for users to publish organogram data. The error messages have been improved too. They now provide detailed information on where there are errors on the data instead of unhelpfully just pointing out that the upload was ‘invalid’.
The responses from the departments that helped us test the new version were encouraging and we are confident that not only will the new process will be simpler and easier for publishers but that it will also help increase the consistency of the data.
Better for users too
We've also improved how organograms are experienced by data.gov.uk's users.
The organogram visualisation is faster, due to a better designed API. (For technical readers - the typical page had dozens of data requests, which we consolidated into just one.) For example Cabinet Office’s old visualisation would take 20 seconds to load the initial 3 roles, and the new version loads in 3 seconds.
The raw data is now catalogued better by data.gov.uk - part of a new drive for ‘consistent metadata’, of which we’ll talk about more in the future.
Finding organogram data is now easier on data.gov.uk. We have placed all organogram datasets under a collection, a grouping of datasets relating to the same topic, meaning users can also perform searches within the collection instead of the whole of data.gov.uk
Rethinking our linked data implementation
One of the key aspects of the original tool was that it was based on linked data, a way of connecting data, potentially making it more powerful to work with. The amount of work required to maintain that kind of setup was high, and made it more difficult to make improvements quickly. With this new version we have concentrated on making publication easier, the CSV output on data.gov.uk better and the visualisation faster.
The existing linked data services will remain available via the SPARQL endpoint and Linked Data API until 15th December 2016. We are reviewing user need for this, so we invite existing and potential users to contact us about this.
Feedback
Please do explore this data and, as for all government datasets, if you create a vizualization or app with it, please add it to the data.gov.uk list of apps. If you have any comments about the way organograms are published on data.gov.uk, please do drop us a line.
Recent Comments