This month’s blog looks at how energy consumption has changed for the 18 headquarter buildings in the six months since August 2010 and considers how energy consumption relates to external air temperatures.
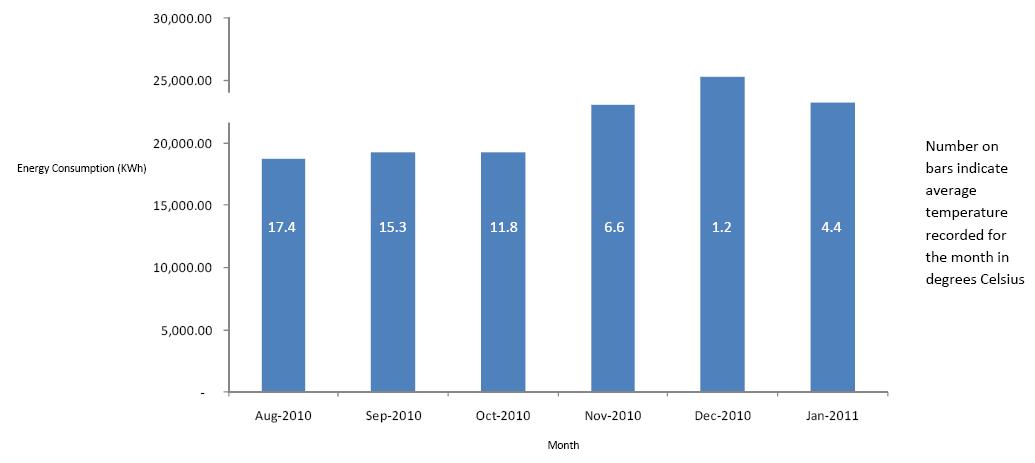
This first chart shows the total energy consumption for the 18 headquarter buildings for each of the last 6 months. As we would perhaps expect, in colder months, the energy demand is higher, reflecting the increases in energy consumption as heating is required.
Chart 1: Average daily energy consumption for the 18 HQ Buildings
We have also considered in more detail the relationship between external temperatures and building energy consumption for buildings. The following scatter charts show the effect of temperature on different types of HQ building by plotting the average daily temperatures since 1 August 2010 against the daily energy consumption figures for the HQ building (excluding weekends).
We have considered two buildings, 70 Whitehall - the Cabinet Office headquarters which is a Grade 1 listed, constructed in 1871 and has no air conditioning - and Caxton House - the DWP headquarters which is a modern air-conditioned building.
Chart 2: Cabinet Office – 70 Whitehall
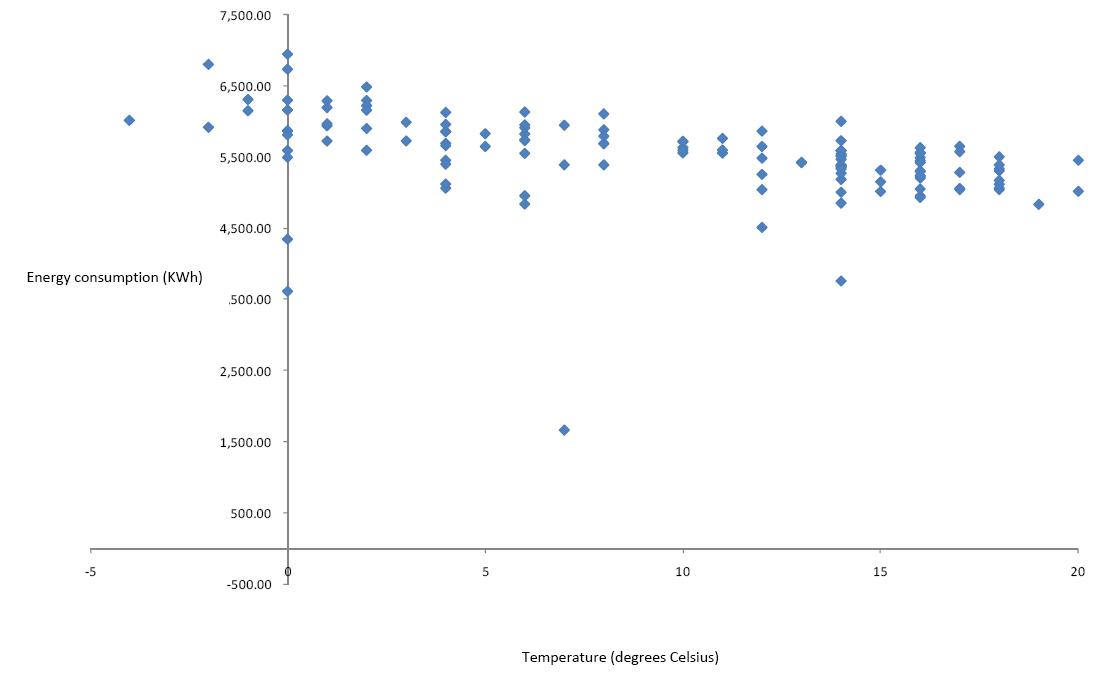
The Cabinet Office HQ building is naturally and mechanically ventilated i.e. there is no air-conditioning, cooling occurs by windows and industrial fan units. In this case we can see that the energy consumed by this building is higher on colder days, when energy is required to provide heat. The optimum (i.e. lowest energy consumption) appears to be around 15 degrees. As temperatures go above this there appears to be a slight increase in energy consumption – this is possibly due to an increase in fan ventilation.
Chart 3: DWP – Caxton House
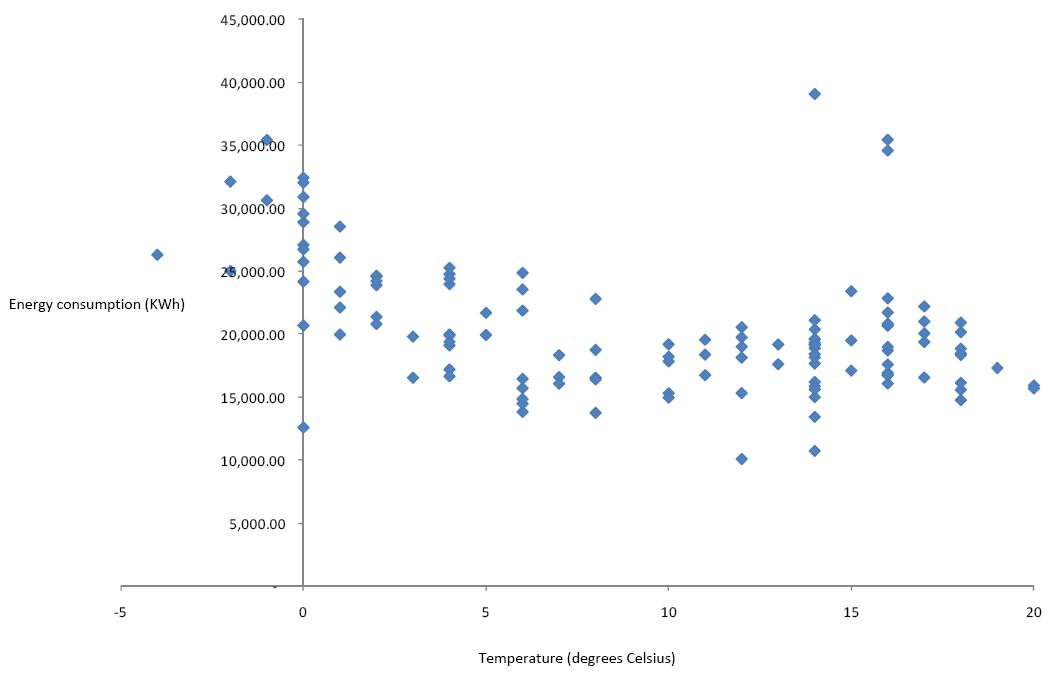
Caxton House is air-conditioned. In this case, the data point distribution has a more curved shape. This is probably because energy consumption increases during hot and cold weather and is at a minimum when temperatures are about 10 degrees.
Some interesting points can be drawn from this analysis:
- There is a link between air temp and energy consumption in buildings
- The correlation will vary from one building to another and a key influence on this is likely to be the presence of air conditioning systems
- This information could potentially be useful for targeting energy performance. For example, based on this type of analysis a department may be able to set a target energy consumption for a given weather condition.
However, it should be noted that it can be difficult to interpret this type of analysis as it may not also be representative of the actual operations occurring in buildings. The scatter graph for Caxton House appears to infer that DWP switches on air-conditioning once temperatures exceed 10 degrees which is not the case. The following reasons could explain this discrepancy:
- The scatter graph was plotted using average daily temperature and not the maximum. Temperatures may have been much higher in the day which would trigger automated cooling systems to activate
- Weather temperature is not always representative of temperature inside a building (known as building temperature set-point) internal temperature set-points can also vary greatly according to the location within a building e.g. Ground and 1st floor may be cooler than the top two floors of a building.
- Different cooling systems may be set to operate once different temperatures are reached. E.g. standard ventilation fan systems are triggered at 10 degrees while air conditioning is triggered at 23 degrees. We do not know how much energy is consumed by standard ventilation/cooling systems in Caxton House.
3 comments
Comment by Anonymous posted on
The work is very great and detailed.
In order to have a accurate measurement for energy, it is better to use some instruments which can support scientific evidence. Take a central air-conditioning as an example, ultrasonic heat flow meter has been applied in HVAC project because of its clamp-on feature.
Comment by Anonymous posted on
These Government buldings consume lot of Energy.
This must be checked and necessary actions should be taken to prevent the Loss
Regards
Mr.Sashi
Comment by Anonymous posted on
our dependence on electricity can be reduced only if we make building which are naturally ventilated and is built with material which is suitable for both winters and summers. We can not change the climatic conditions and weather but we can certainly change our lifestyle and make more eco friendly buildings for less power consumption.