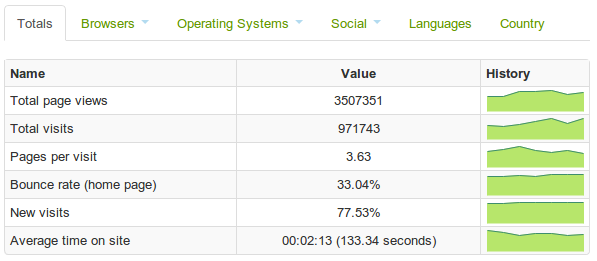
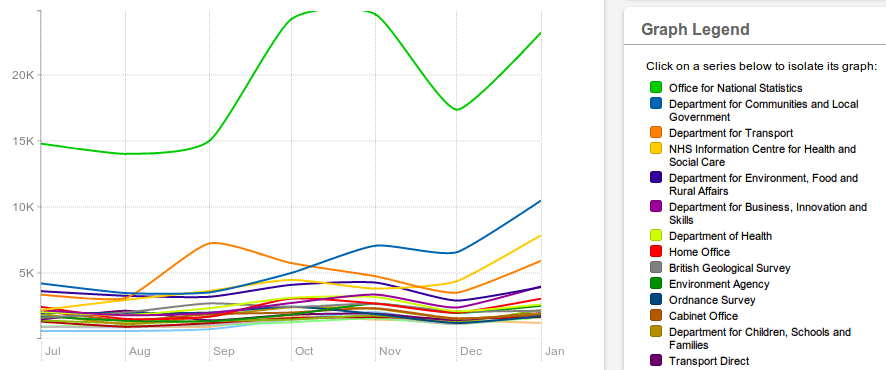
Today we've enhanced our Site Usage pages, introducing graphs and data download measurement. This highlights the datasets that are attracting most interest in each month and shows how the site is doing in terms of overall metrics, such as total viewings and the average time a user views the site for. We are often asked for data on usage of data.gov.uk and we feel this is the best way to release it openly to all parties.

There is interest in how well the site as a whole is performing. 'Bounce rate' for the home page (visitors who come to data.gov.uk and then leave straight away) is acceptable at 30% (compared to similar sites), and far better than the high numbers seen with the home page before the relaunch last June. The little 'sparkline' graphs for each metric will help evaluate changes over time.
There is also plenty of scope to examine the changing user interest between the different publishers as they release more data and interest in particular datasets get boosted, for example by a current news story. Data from the Office for National Statistics gets the most interest, and that makes sense as they have a large number of data listed. But what was their massive spike in interest in October and November?

Clicking through to ONS's breakdown shows the interest was in A Generational Accounts Approach to Long Term Public Finance in the UK, which was probably in the news then. However clicking through to the data provides only the PDF report, and broken links for the spreadsheets behind it. So out of 9000 odd datasets, we can see a clear priority to fix this link!

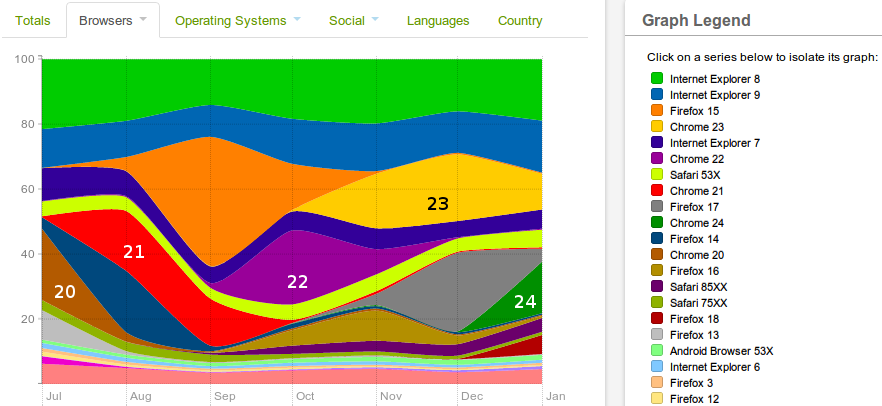
The Site Usage also shows properties of users, such as their country, operating system and browser, that help us design for the right audience. The high number of developers using the site is clear from the use of Linux at 13% compared to averages at 1 to 2% elsewhere. I've annotated the graph above to show how quickly our users upgrade their Chrome browsers - only about 2 months are needed for the vast majority to upgrade.
Chrome and Firefox appear in stark contrast to slow upgrading of Internet Explorer. This is due to the use by large institutionals, particularly Government departments, who use old versions for a number of reasons. IE overall accounts for 39%, which is above the average of around 30%. We decided not to support IE version 6 (12 years old this August) on data.gov.uk, and we see usage has dropped under 1% now (click on it in the legend to isolate it). But IE 7 (6 years old) remains for about 5% of our users, so it seems sensible to continue to have to support it, even though it creates the majority of headaches for us developers...
Alongside the graphs and tables are links to download the raw data in CSV format, which contains more detail. As for much of the data listed on data.gov.uk, this provides plenty of scope for anyone to hack around with it to find meaning. If you do come up with something of interest, please let us know in the comments below.
6 comments
Comment by exstat posted on
Owen
The page that contains the metadata does carry the National Statistics logo if the dataset is indeed National Statistics. It is not visible if you list a series of search results, though perhaps it could be.
The NS logo is not itself an indication of data quality, I'm afraid. It is far more about procedures, such as whether it is released to a pre-announced timetable, whether pre-release access (if any) is limited to a named list of individuals and (of course) without political interference. If you do that, you could release a complete load of dingoes' kidneys and still have the logo! Conversely, there may be excellent data sources which breach one or other of the NS conditions.
Have to admit that's one of the reasons I'm glad I'm an exstat rather than a stat (*), as the process of demonstrating adherence to said conditions could take time which was desperately needed to maintain or improve the quality of the product itself, while some of the conditions, if applied unthinkingly, could actually make it too difficult to produce the output at all. One of the conditions that was being worked up was that all outputs should have commentary. Fine for a single output, but not so good for a compendium product where you don't get some of the data until a day before publication, and where you would have to rely on the originator of the data for worthwhile commentary. Delay to enable a commentary to be produced and you are in breach of another condition, that data should be released as soon as possible - and I'd bet that you would STILL get some of the data the day before publication, because the date is preannounced so people know what the final deadline is.
That's not to say that NS conditions are bad in themselves (any more than the Open Data star ratings are), just that they (just like the Open Data star ratings) are not equally suitable for all outputs and are liable to be misinterpreted as telling you that the data themselves are great.
(*) I can watch more cricket as well!
Comment by Owen Boswarva posted on
Okay, thanks. My comments might be more relevant to official statistics vs other outputs, rather than national statistics specifically. I appreciate that quality can be variable on a dataset by dataset basis, regardless of designation.
I can't see a National Statistics logo myself. Could you point me to an example so I can trace how it's recorded in the metadata? There are some examples where the designation is mentioned in the free-format description, e.g. this Home Office dataset. However if the designation is being recorded systematically as well that could be quite useful.
-- Owen Boswarva, 21/02/2013
Comment by exstat posted on
Try http://data.gov.uk/dataset/annual_bus_statistics for the nice little blue and green logo.
Fair point about "official statistics" versus "non-statistical". Part of me says that a GSS logo for official statistics would be a good idea, but there can be good statistical datasets produced entirely outside the GSS (though hopefully with some GSS guidance if within central government) and it would be wrong to (sort of) dismiss these. The other part says that there is probably an ambition to turn the vast majority of central government statistics into National Statistics, and any other logo would be resisted as diluting the impact of NS.
To be fair, it's over two years since I was involved with National Statistics for real. Attitudes might be quite different now.
Comment by exstat posted on
Nice blog, though I was disappointed not to be able to follow the exhortation on the graph to click to see an individual series! Have to subtract a few starts for that...
Interesting to see ONS so far out in front. As you say, they have lots of datasets out there (and their outptus are usually of genuine analytical use!) but few of their outputs are announced as such on the home page of this site. I have observed before that this is dominated by "spend over £25K by health authority X" announcements, and it would be informative to see how many (or should it be how few?) hits such datasets get. It might provide a pointer as to how much scarce resource it is worth putting into making different types of dataset available.
By the way, when you say "ONS", do you mean "National Statistics"? There are large numbers of outputs produced by statisticians within other government departments. If you really do mean "ONS", statistics as a whole would probably be ever further out in front.
Statistical outputs, ONS or otherwise, are often accessed by going direct to the National Statistics website, or to the website of the department that produces them. It would be interesting (though perhaps not easy to do) to have some idea whether the bulk of the traffic to these sites is coming in via data.gov.uk. I would hazard a guess that regular users of statistics go straight to the data while more casual browsers (the regular users of tomorrow?) might come through this site. Nothing wrong with multiple access routes, of course, as long as all the links work.
Comment by Owen Boswarva posted on
I think in this context "ONS" simply means datasets for which the Office of National Statistics is the publisher, rather than "National Statistics" as a category.
It would certainly be useful if Data.gov.uk metadata records indicated which statistical datasets from other publishers are also categorised as National Statistics, given the range of quality in statistical outputs from certain Government departments.
Your point about regular data users going directly to source is important. It's very difficult to judge to what extent Data.gov.uk usage stats by themselves are representative of interest in public data.
-- Owen Boswarva, 20/02/2013
Comment by iancoady posted on
The usage stats are very clear and its good to see LSOAs remain one of the top datasets on D.G.U. One additional breakdown that I would find useful would be a breakdown by dataset classification. Particularly, the ability to view the stats for all geographic datasets would allow us to measure the demand for our products against similar geographic products from other government organisations.